Using Voronoi Diagrams to Equally
Divide/Allocate Adjoining Space Between Polygons
Problem description
Given a set of arbitrary polygons belonging to different categories, we want to equally divide the space between polygons and compute the square footage of each category. For example, given different categories of machines on a factory floor; for each category, we need to sum up the area of each machine outline and its buffer zone on the factory floor.
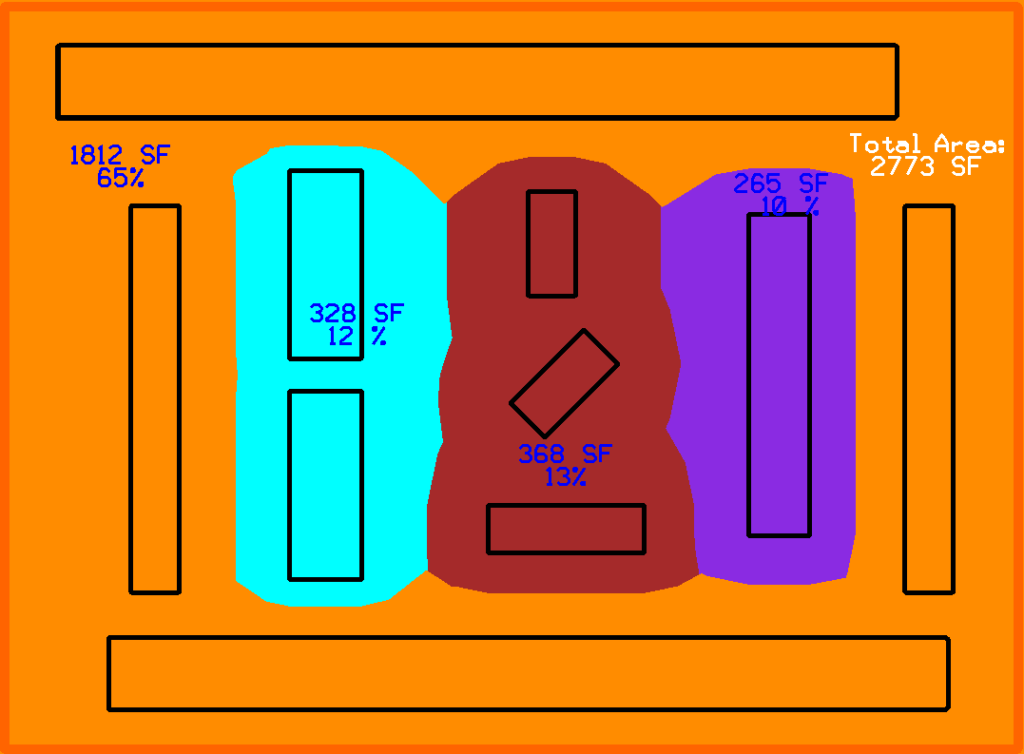
The following images show a set of polygons in different color-coded categories.
Introduction
We tried several approaches to compute the square footage including expanding the polygons until they intersect with each other and sending rays outward from each polygon to find its neighbors to compute the midpoints between polygons. Neither approach was successful. We needed an algorithm to find the buffer zone for each polygon in such a way that the space is equally divided between any two adjacent polygons. The question is how to computationally divide space occupied by an arbitrary polygon and its neighbors?
How to divide space between a set of polygons
To divide the between polygons, we found a concept in Computational Geometry called Voronoi Diagrams to find the set of midpoints between each polygons and its neighbors. We were able to use the Voronoi cells from each polygon diagram to construct center-lines between all polygons. This allows us to easily divide/allocate the area from each polygon but category.
Voronoi Diagrams
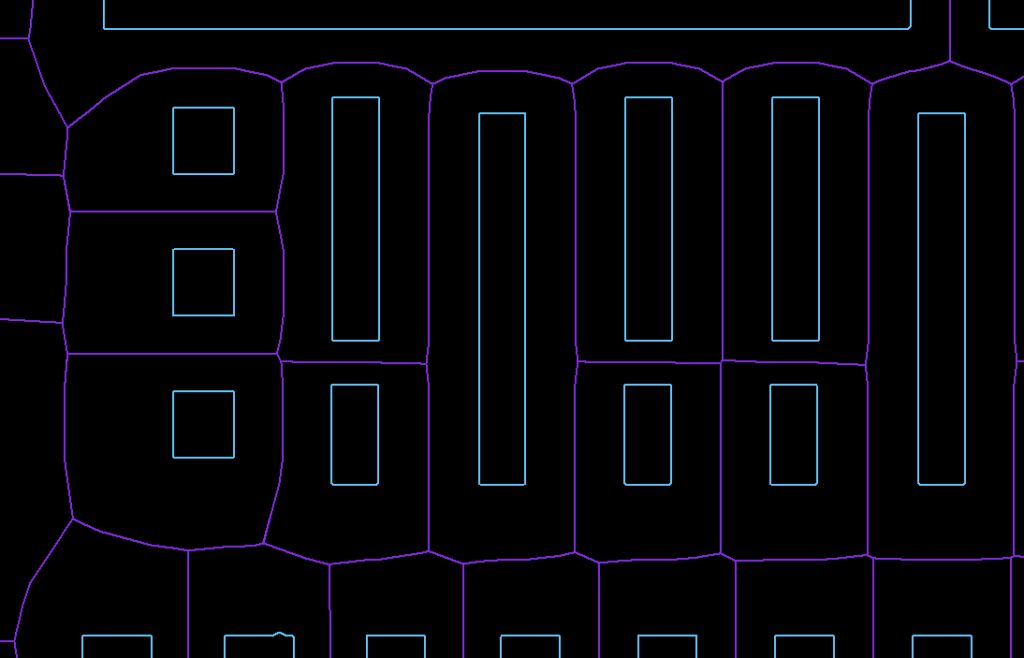
The simplest definition of Voronoi Diagrams is it being the partition of a plane into a set of regions close to each of a set of objects. In other words, given a set of points in a plane, a Voronoi region/cell of a point A is an area encompassing points closer to A than any other points in the plane. To use Voronoi Diagrams with a set of polygons, we need to compute a cell for each segment of a given polygon. By performing a union on the resulting Voronoi cells, we find the center lines between the polygon and its neighbors (See example below).
Following image shows a Voronoi cell for each segment with matching colors:
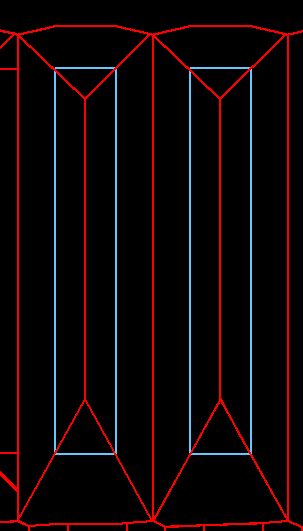
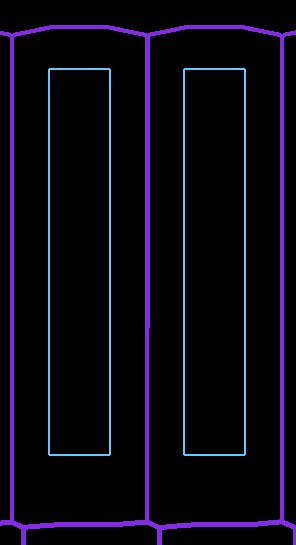
Following images show the Voronoi cells (in red) for the segments of two adjacent polygons and the final centerlines in purple after performing the union of the Voronoi cells:
Step-by-step process of finding the centerlines
- For each polygon, extract segments and assign them an id to associate them with their original polygon.
- Use Boost Geometry Library to compute Voronoi cells for each segment
- Identify all segments of the same polygon and perform a boolean union of the cells associated with them.
The Boost Library provides a very efficient and easy-to-use function to compute the Voronoi Diagrams of any set of non-intersecting segments (except endpoints of consecutive segments). By passing the segments of each polygon to the Boost Library, we’re computing the Voronoi cell for each segment then we’re performing a boolean union of all resulting Voronoi cells. As mentioned before, the union will be a shape representing the centerlines between the polygon and its direct neighbors.
Please note that in the following C++ example, our polygons are stored in a collection called vPolygons. Also, segments are instances of the Segment_vd class which takes the coordinates of the segment endpoints and the index of the containing polygon as inputs to the constructor.
 // building a collection of segments from each polygon
 // for each polygon
	for (unsigned index_polygon=0; index_polygon<vPolygons.size(); index_polygon++)
	{
		Polygon poly = vPolygons[index_polygon];

   // for each segment in current polygon
		for (int i=0; i< poly.numPnts; i++)
		{
			int curr = i, next = i==poly.numPnts-1?0:i+1;
			DPoint3d currP=poly.shapePnts[curr];
			DPoint3d nextP=poly.shapePnts[next];

      // add segment to collection with id = index_polygon
			segments.push_back(Segment_vd(currP.x, currP.y, nextP.x, nextP.y, index_polygon));
		}
	}

	// Construction of the Voronoi Diagram.
	voronoi_diagram<double> vd;
	construct_voronoi(points.begin(), points.end(), segments.begin(), segments.end(),	&vd);
Conclusion
As shown above, Voronoi Diagrams were very essential in resolving our problem of area contribution by generating the midpoints between the polygons. Other applications for Voronoi Diagrams can also be found in various areas of study including indoor/outdoor navigation, robot motion, 3D Graphics, health, engineering and even natural sciences.
Helpful links:
Boost Library: https://www.boost.org
Voronoi Diagrams Tutorial from Boost Geometry Library: https://www.boost.org/doc/libs/1_80_0/libs/polygon/doc/voronoi_diagram.htm
Interactive Voronoi Diagram Generator: https://alexbeutel.com/webgl/voronoi.html
Wolfrom Definition of Voronoi Diagrams: https://mathworld.wolfram.com/VoronoiDiagram.html


